Technical Appendixes to What Is the Price of the Jones Act?

These appendixes provide the technical detail behind the calculations in the issue brief What Is the Price of the Jones Act?1 They were prepared by the author and are provided as supplementary material.
These appendixes provide the technical detail behind the calculations in the issue brief What Is the Price of the Jones Act?1 They were prepared by the author and are provided as supplementary material.
Appendix A: Compression Model Inputs and Assumptions
Benchmark voyages:
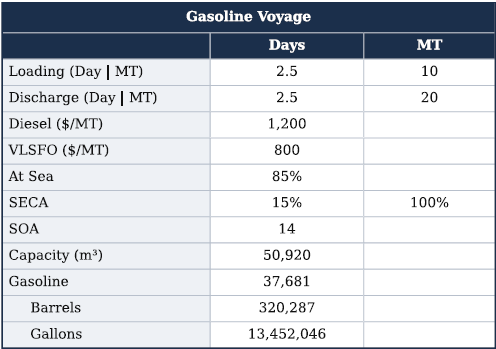
The international benchmark is a medium-range (MR) product tanker loading Reformulated Blendstock for Oxygenate Blending (RBOB) gasoline at the Amsterdam-Rotterdam-Antwerp hub for delivery into New York Harbor (“TC2” index) quoted by the Baltic Exchange.2 It comprises 3,350 nautical miles (nm), 10 days at sea, part of which is within Sulfur Emission Control Areas (SECAs), and part is not. The Jones Act benchmark is a U.S.-built MR on the same cargo quantity and quality specifications from Houston to New York Harbor, 1,929 nm, six days, entirely within the U.S. SECAs. Delivered cost is stated in cents per gallon (cpg) using a control parameter of 357 gallons (8.5 barrels) per metric ton. This is the freight component of the delivered barrel. Each of the benchmarks (and all other compression scenarios) uses a $150,000 allowance for tank cleaning, U.S. Coast Guard inspection, Oil Companies International Marine Forum Ship Inspection Report Programme inspections, and other contingencies that can be predictably simulated.
Table A-1. Benchmark Gasoline Voyage Parameters
Financing:
Each vessel is solved to a net present value of zero, using an equity hurdle rate of 15%, a 15% tax rate, and a scrap value of $7.3 million. We depreciate on an 18-year straight-line basis and a simulated 70% loan-to-value at 200 basis points over the reference rate plus 1.2% in fees. We assume the debt can be rolled on schedule, so for ease of calculation we match its amortization to the asset depreciation. While we accept that this is used for simplicity’s sake, the practical impact on the model is limited, given our recommended compressions.
The international MR tanker clears at a capital charge of $17,000 per day and operating cost of $7,366; the U.S.-built MR tanker at $65,750 and $22,294. Newbuild prices are carried at the multiples of section V, 2.6 times for the liquefied natural gas (LNG) carrier at a greenfield yard and 3.8 times for the MR tanker at existing yards.
Levers:
Cost-compression levers are applied cumulatively. Credit enhancement is modeled as a Title XI guarantee on its best terms, an 80% advance rate with the depreciation schedule unchanged.
Tax parity is modeled as tax equity harvesting (transferability) on a 12-year economic and depreciable life.
Allied capital is modeled at an East Asian policy bank debt level, with the currency exposure hedged and fees at the higher level those lenders charge.
Shipbuilder economics is the yard’s cost reduction passed through at the 10th hull of a series, derived from the power law learning curve of appendix C and applied to the operating, investment, and overhead lines of the build price. The resulting capital charges are $55,675, $49,475, $42,675, and $37,935 per day.
Table A-2. Compression Model
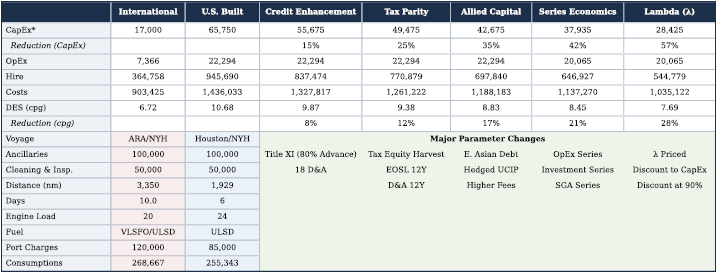
Note: DES is delivered ex ship; cpg is cents per gallon; nm is nautical mile; ARA is Amsterdam-Rotterdam-Antwerp; NYH is New York Harbor; VLSFO is very low sulfur fuel oil; ULSD is ultra-low sulfur diesel; EOSL is end of service life; D&A is depreciation and amortization; UCIP is uncovered interest rate parity; OpEx is operating expenses; SGA is selling, general, and administrative; CapEx is capital expenditures. All costs in U.S. dollars. Benchmarks are defined as (1) an internationally built medium-range (MR) tanker on the ARA to NYH voyage, and (2) a U.S.-built Jones Act MR tanker on the Houston to NYH voyage, each solved to a net present value of zero. Compression columns apply the levers cumulatively.
* CapEx is defined as the amount at which each vessel’s net present value equals zero (within ±$50,000) based on uniform model standards. Unless a lever changes them, the model assumes 18-year straight-line depreciation and amortization, a 70% loan-to-value ratio at 200 basis points plus 1.2% in fees, and a scrap value of $7.3 million.
Shadow price:
The shadow price of maritime capability, λ, is the sum of the four terms of section VI, S (sealift and surge), β, Π, and aKL. Its parameters, and present value outputs are set out in appendix B, and its application is embedded in section VII.
Stipend benchmarks:
The Maritime Security Program retains about 60 vessels at roughly $6.5 million per vessel per year; the Tanker Security Program is authorized up to 20 vessels at $8.16 million for fiscal years 2025 and 2026, rising to $9.833 million by fiscal years 2039 and 2040, under a program authorized through 2040. These are the revealed lower bounds against which λ is checked.
Sensitivities:
The results most sensitive to judgment are the 90% application rate (see the note to section VII), the β term and the human capital term of the shadow price. Each enters the compression model only through the final column, so the residual gap moves in proportion to each and none of them changes the ordering of the levers or the share of the wedge that private and allied capital close on their own.
Appendix B: Externality Ledger Derivation
This appendix sets out the parameters behind each term of the shadow price in section VI. All present values are taken over a 15-year life cycle. The income tax term and sealift/surge option values are discounted at the 15-year Treasury rate of 5.62%; the corporate tax term at a 9.23% corporate weighted average cost of capital. Annual figures are stated per ship unless noted.
Sealift and surge (S): The reference price is the Tanker Security Program stipend of $8.16 million per vessel per year. We split it 80:20 into a static component of $6,528,000, the value that makes a foreign ownership, control, or influence–mitigated fleet possible, and a dynamic component of $1,632,000, the value of surge. The option value the fleet holds on the government’s behalf is the operator’s margin on those amounts: an intrinsic margin of 15% on the static component, $979,200 a year, and an extrinsic margin of 3% on the dynamic component, $48,960 a year. Over 15 years, these sum to $14,688,000 and $734,400, with present values of $6,468,003 and $323,400. Both accrue to sealift service; the commercial vessel is credited with neither.
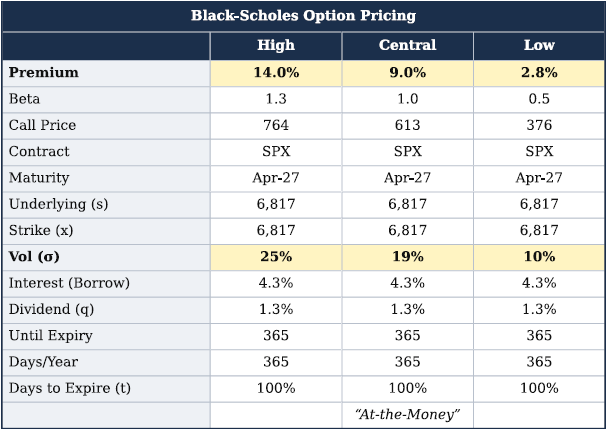
Disruption mitigant (β): The base is the residual value of an internationally priced asset, taken for simplicity at 10% of newbuilding value, $5 million, so that the volatility-enhancing attributes whose price is β itself are stripped out. β is priced at about 9% from 12-month rolling at-the-money call options on U.S. equities, adjusted for observed volatility (VIX) and overlaid with outcome-based scenarios from the five-factor risk model (sovereign, intersovereign, operational, liquidity, and systemic). Utility factors of 10% for sealift and 60% for commercial service give $42,906 and $257,438 a year; the 15-year sum is $4,505,171 and the present value $1,983,896.
Table B-1. Option Pricing Scenarios for the Disruption Mitigant (β)
Dependency mitigant (Π): The base is $8 million of exposed operating margin. A three-sigma adverse shift in dependency (μ ± 3σ, about 0.27%, or one event in 370) is applied to it, with utility factors of 100% for sealift and 75% for commercial service, giving $21,600 and $16,200 a year. The 15-year sum is $567,000 and the present value $249,684.
Income tax: Per mariner: a salary of $100,000 a year of which 25% is taxed, $25,000. Per ship: $1 million a year on the commercial crew basis. The 15-year sum is $15 million and the present value at the Treasury rate $6,982,287.
Labor enfranchisement: Per mariner: $81,000 a year, comprising direct transfers of $10,000, fiscal draws of $20,000, welfare impairment of $1,000, and delinquency of $50,000. Per ship: $3,240,000 a year. The 15-year sum is $48,600,000 and the present value $22,622,610. Applying the IMPLAN regional services multiplier of 1.25 to the income tax and labor enfranchisement terms combined gives $37,006,122 of direct, indirect and induced effect; this is the upper bound reported in section VI and is not carried in the shadow price.
Corporate tax: earnings before interest and taxes of $10 million per ship under an updated tonnage tax yields $500,000 a year for both sealift and commercial service. The 15-year sum is $7,500,000 and the present value at the corporate cost of capital $1,994,951. Total: The ledger sums to $40,624,831 in present value: S = $6,791,403; β = $1,983,896; Π = $249,684; aKL $31,599,848 (income tax, labor enfranchisement and corporate tax).
Spread evenly over the 15-year cycle, that is $2,708,322 per vessel per year, the shadow price of section VI.
Appendix C: Compensated Gross Tonnage and the Series Transfer
The common unit of yard output is compensated gross tonnage, which is the shipbuilding industry’s own normalization of output across vessel types, adopted by the Organisation for Economic Co-operation and Development, Japan, Korea, and the European yards so that a yard building tankers and a yard building gas carriers can be compared on work content rather than on hull count.3
The issue brief uses it as a stated fact rather than as a model input because the MR tanker is used at its observed 3.8 times premium instead. Practically, this is because a shipowner pays on deliveries, not on yard efficiency metrics. We don’t use compensated gross tonnage (CGT) frames because this a practical case for mixed order books that accommodate differing complexities, workforce rotation, and hull counts.4 Naval auxiliaries, MR tankers, and LNG carriers can all buy down the same fixed cost, and a yard’s progress toward its CGT threshold does not care which of them supplied the tonnage. That is the coproduction argument, not really the series argument.
We deploy what’s called the power law model as the canonical learning curve optimizer with a progress ratio as the fraction of cost that remains each time cumulative output doubles.5
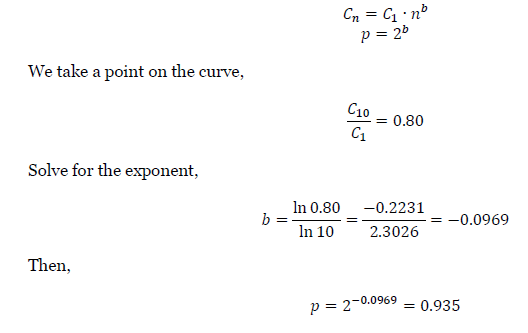
We do the same for time of doubling: going from hull 1 to hull 10 is log210=3.32 doublings, so the per doubling ratio is 8013.32⁄=0.935. A 93.5% progress ratio means cost falls about 6.5% per doubling.
- See Ryan Lynch, What Is the Price of the Jones Act? (National Center for Energy Analytics, 2026).
- The Baltic Exchange publishes shipping freight benchmarks. Tanker clean (TC) refers to the shipping route indices for refined fuels.
- See Organisation for Economic Co-operation and Development (OECD), A New Compensated Gross Ton (CGT) System (OECD, 2006), 7, 11. Compensated gross tonnage (CGT) = A × gtB, where gt is gross tonnage and A and B are coefficients by ship type; for double-hull oil tankers, A is 48 and B is 0.57; for liquefied natural gas (LNG) carriers, A is 32 and B is 0.68. On those coefficients, an MR2 product tanker of about 30,000 gt is roughly 17,000 CGT and a 174,000 cubic meter LNG carrier of about 115,000 gt is roughly 88,000 CGT: one LNG carrier is a little over five MRs of yard work.
- The buyer pays on deliveries, not on CGT; the unit matters to the yard’s fixed-cost recovery and to the sequencing of an order book, not to the price the shipowner contracts.
- See Louis E. Yelle, “The Learning Curve: Historical Review and Comprehensive Survey,” Decision Sciences 10, no. 2 (1979): 302–28, on Wright’s log-linear specification with progress ratio 2^b.